How Much Data Does an Up/Down Trading Bot Need?
A 5-minute BTC market settles 288 times a day — that is your training-label budget. Real contract counts, trade volumes and a data plan for up/down bots.
Every supervised model for short-horizon event contracts — will BTC close this 5-minute window up or down? — is bounded by a number most builders never compute: how many independently settled windows exist at all. This guide puts real numbers on that budget using the CryptoStruct archive of Kalshi and Polymarket tick data, and lays out a data plan that avoids the two classic failure modes: too little history, and leaked history.
Everything below runs on the CryptoStruct archive: every message Kalshi, Polymarket and 35+ crypto venues publish — every Level-2 snapshot and update at full depth, every trade, every contract, every day since we added the venue — captured co-located with nanosecond venue and receive timestamps and a gap-audited event-id chain, in one normalized schema. It is the same capture our own trading engine and enterprise feeds run on, sold as €1 day bundles you buy as a guest in the Data Shop with instant download — no subscription, no minimum, no sales call. Free full-day samples let you run every command in this guide before paying.
The collection trap: why you cannot API your way to a dataset
The obvious plan — subscribe to the venue's API and start recording — has a structural flaw: it only moves forward. A market that settled yesterday no longer streams; its order-book evolution is gone unless someone recorded it live. Short-interval series make this brutal: each 5-minute market exists for minutes and is replaced by the next one. Start recording today and in three months you have three months — while the model next door trains on a year.
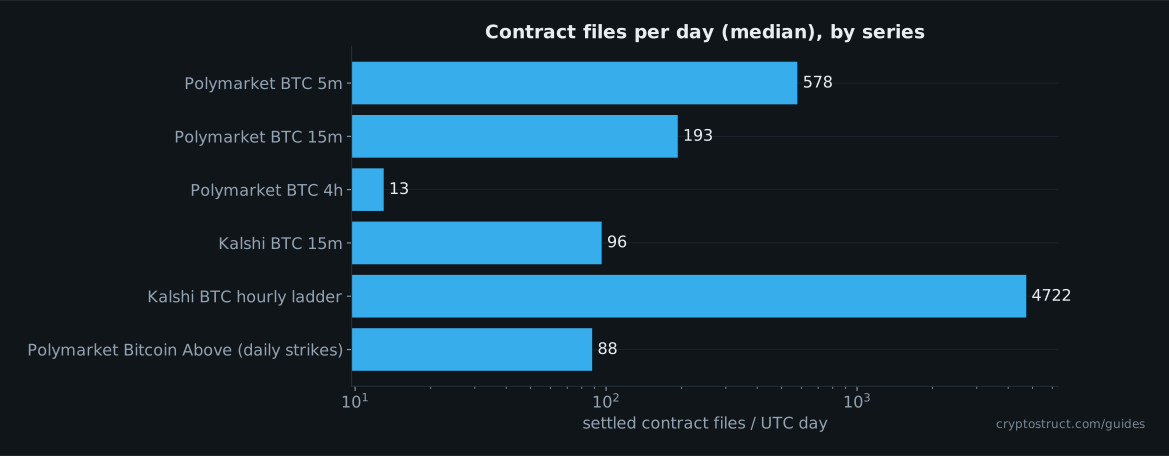
This is what series-day bundles exist for: one bundle contains every contract file of a series for one UTC day — for Polymarket BTC 5m that is ~577 files covering all 288 windows, tick-by-tick trades plus full L2 order-book depth, recorded co-located with exchange timestamps. History becomes something you buy per day (€1), not something you wish you had started recording earlier.
How many training examples a series actually produces
For fixed-interval up/down markets the arithmetic is merciless: windows per day × days of history. Nothing about your feature engineering changes the left factor — only choosing a faster series or buying more history does.
| Series | Windows / day | Contract files / day (median) | Trades / day (30d avg) | Archive days |
|---|---|---|---|---|
| Polymarket BTC 5m | 288 | 578 | 553,960 | 180 |
| Polymarket BTC 15m | 96 | 193 | 91,670 | 306 |
| Polymarket BTC 4h | 6 | 13 | 2,861 | 301 |
| Kalshi BTC 15m | 96 | 96 | 437,408 | 166 |
| Kalshi BTC hourly ladder | 24 | 4,722 | 287,774 | 166 |
Source: CryptoStruct archive rollups, 2026-08-12. Polymarket lists separate Up and Down contracts per window (hence ~2 files per window); the Kalshi hourly ladder lists ~200 strikes per hour.
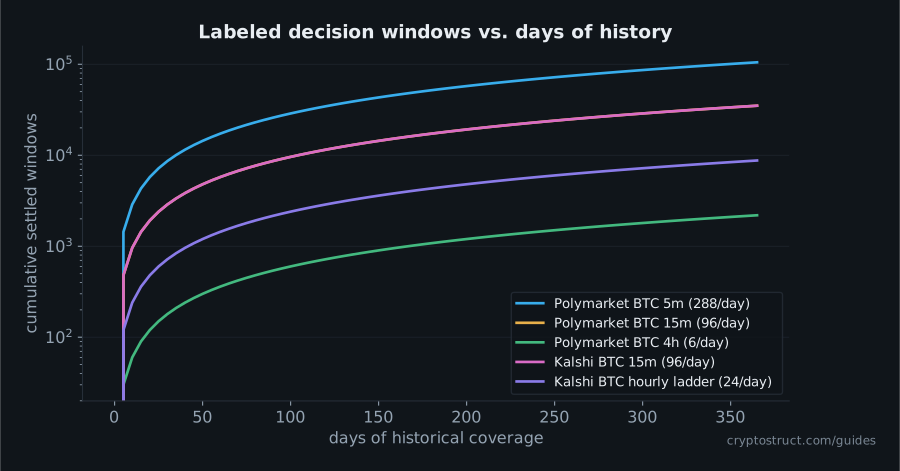
As a rough calibration: classical tabular learners (logistic regression, gradient boosting) start behaving sensibly in the thousands of examples; anything representation-heavy wants far more. On that scale a 4h series with 2,190 windows per year is a feature-engineering exercise, not a deep-learning dataset — while a 5m series crosses 100k windows in a single year. Whatever you train, more independent windows across more market regimes beats more parameters.
A window is more than a label
Each settled window contributes one label — but the tick file behind it contains the entire path: every trade with price, size and side, and every L2 order-book change, at nanosecond timestamps. That is where features live: odds mid and its velocity, book imbalance, trade-flow direction, time-to-settlement interactions. On the Kalshi 15m series alone that is ~437k trades per day to learn microstructure from, and the hourly strike ladder adds cross-strike structure — an implied distribution, not just one probability.
| Series | Venue | Days | Coverage | Size | |
|---|---|---|---|---|---|
| BTC Up/Down 5m | Polymarket | 254 | February 2026 – present | 267 GB | Browse days |
| BTC Up/Down 15m | Polymarket | 380 | October 2025 – present | 132 GB | Browse days |
| BTC Up/Down 4h | Polymarket | 369 | October 2025 – present | 5.22 GB | Browse days |
| BTC Up/Down 15m | Kalshi | 240 | February 2026 – present | 118 GB | Browse days |
| Bitcoin price Above/below | Kalshi | 240 | February 2026 – present | 197 GB | Browse days |
| BTC Above (price strikes) | Polymarket | 526 | May 2025 – present | 66.8 GB | Browse days |
Live archive coverage of the series discussed here (updates daily).
Split by time, or leak by construction
Adjacent windows are not independent samples: the 14:05 and 14:10 BTC windows ride the same underlying price path, the same volatility regime, often the same news. Randomly shuffling windows into train and test therefore leaks the near future into training, and validation scores inflate accordingly. The honest protocol is walk-forward: train on a contiguous past, validate on the contiguous next block, roll forward — and purge or embargo observations whenever feature or label horizons overlap. Derive the minimum gap from the maximum feature lookback plus the label horizon, and add separation when residual serial dependence remains.
105k windows from a calm quarter teach a model that nothing ever happens. Make sure training spans visibly different regimes — the archive's 180 days of BTC 5m cover both quiet ranges and violent repricings, and the per-day bundle model lets you buy exactly the regimes you are missing.
Define labels from settlement rules, not from your chart
Each venue settles against a specific reference (its own index computation, at a specific cutoff, with specific rounding). Recompute your label from the venue's settlement rule — do not eyeball "close > open" on a candle from a different exchange, or a slice of your labels will simply be wrong, and wrong labels are noise you paid for. Derive labels from the venue's official settlement or resolution metadata and the contract's settlement rule — never infer the final outcome from the last traded price alone.
Data playbook
- Pick the horizon to match your label budget: 5m/15m series for ML-scale datasets, hourly ladders for distribution signals, 4h+ only with strong priors.
- Start with free full-day samples — one complete Kalshi and Polymarket contract day each — to build and test your parser before spending anything.
- Buy history per regime, not per calendar: cover at least one violent repricing period and one quiet period per season of data.
- Extract features from the book path (mid, imbalance, trade flow), not only from the final odds — the label is one bit; the file is the signal.
- Validate walk-forward, purging or embargoing wherever feature or label horizons overlap; report performance per regime slice, never as one pooled number.
- Recompute labels from settlement rules inside the files; audit a random sample by hand before training.
From research to production
The archive side is self-serve: browse series-day bundles in the shop at €1 per day, parse them with the free Python reader, and cross-check against the free per-minute statistics API. When a model graduates to live trading, the same normalized feed is available in realtime — see the latency guide for where to run it.
Limitations
Contract and trade counts are archive measurements as of 2026-08-12 and grow daily; trade averages cover the trailing 30 days only (the venues' statistics retention). Coverage starts differ per series (Kalshi recording began February 2026, Polymarket BTC 15m October 2025, 5m February 2026). Window counts are upper bounds on labels — occasional venue outages produce partial days, and Kalshi's scheduled maintenance (every Thursday 03:00–05:00 ET) shortens its 15-minute and hourly crypto series by 8 and 4 windows (marked ⓘ in the shop — exchange downtime, not a data gap). Nothing here is investment advice: data volume makes models trainable, not profitable.
Why buy the data in this guide here
Four things every page on this site is built on — and the reason the numbers above exist at all.
We record everything
The complete public feed of each venue as it was published: every Level-2 snapshot and update at the venue's full book depth, every trade with its aggressor side, every quote, funding, mark-price and liquidation event — for every instrument the venue lists, every UTC day since we added the venue. Nothing sampled, no top-N cut, no on-demand capture.
Institutional grade
Captured co-located at the venue with the exchange timestamp and our receive timestamp in integer nanoseconds, an event-id chain that makes any gap visible, and one normalized schema across 35+ venues — the same capture our own high-frequency trading engine and enterprise feeds run on.
€1 per instrument-day
Any instrument-day is €1, series-day bundles start at €1 — no subscription, no minimum order, no tiers to unlock. Credit packs lower the effective price and never expire, and every venue has free full-day samples to test against first.
Self-service for everyone
Pick the days in the Data Shop, pay by card as a guest and download immediately — no sales call, no enterprise contract, no KYC. Coding agents buy the same files through the MCP server, and the free Agent Skill teaches them the format.
Agents: /llms.txt · MCP server /mcp · every page as markdown via Accept: text/markdown
Frequently asked questions
How much historical data do I need to train a prediction-market bot?
Count settled windows, not gigabytes: a 5-minute series gives 288 labeled windows per day (~105k per year), a 15-minute series 96. Classical models want thousands of windows spanning several market regimes — for a 5m series that is a few weeks minimum, for slower series correspondingly more.
Where can I download Polymarket historical order-book data?
The CryptoStruct archive sells it as series-day bundles: all contract files of a series for one UTC day (trades + L2 depth, tick-by-tick) for €1. Free complete sample days are on the downloads page.
Why not just record the venue APIs myself?
Recording live is the right long-term move, and venue APIs can backfill some market, trade and price history — but they generally do not let you reconstruct the full tick-by-tick order-book path after the fact. Archived day bundles carry that live-recorded history from before you started.
Should I split prediction-market training data randomly?
No. Adjacent windows share the underlying price path, so random splits mix highly dependent observations across train and test and can materially inflate validation scores. Use walk-forward splits, and purge or embargo observations around the boundary whenever feature or label horizons overlap.