Kalshi vs Polymarket: the Same Market, Two Order Books
Same BTC up/down market, two venues: measured spreads, book depth, trade volume and settlement behavior from one shared day of tick data — 97 windows each.
Kalshi and Polymarket list the same flagship crypto product: will BTC close this 15-minute window up or down? That makes the pair a rare clean experiment — one underlying, one contract design, two market structures. We replayed every contract book of both venues for one shared UTC day (2026-08-21, 97 fifteen-minute windows per venue, recorded co-located in the same schema) and measured what a trader or a bot actually faces: spread, size at the touch, trade flow and how the books behave into settlement.
Everything below runs on the CryptoStruct archive: every message Kalshi, Polymarket and 35+ crypto venues publish — every Level-2 snapshot and update at full depth, every trade, every contract, every day since we added the venue — captured co-located with nanosecond venue and receive timestamps and a gap-audited event-id chain, in one normalized schema. It is the same capture our own trading engine and enterprise feeds run on, sold as €1 day bundles you buy as a guest in the Data Shop with instant download — no subscription, no minimum, no sales call. Free full-day samples let you run every command in this guide before paying.
The comparison: one day, window-anchored, both books replayed
Method matters here more than usual. A Polymarket up/down book starts streaming hours before its window opens and keeps streaming after it closes — the median Polymarket BTC 15m file in our sample spans ~12.7 hours, versus ~15 minutes for its Kalshi twin. Naively averaging over the whole file would mostly measure Polymarket’s resting pre-open quotes. Every statistic below is therefore computed strictly inside each contract’s 15-minute trading window (derived from the contract identifier and verified against the last trade of each book), time-weighted over the L2 replay.
- Venue coverage of the series differs: Polymarket’s 15m series reaches back to 2025-10-09 (319 archive days), Kalshi’s to 2026-02-26 (179 days).
- Both venues publish full order-book depth and no separate best-bid/offer stream — everything below is reconstructed from snapshots plus updates, exactly what the archive files contain.
- Contracts pay $1; prices quote 0..1 (Kalshi in USD, Polymarket in USDC). "¢" below means cents of that $1 payoff.
Spreads: sub-cent on Kalshi, one cent on Polymarket
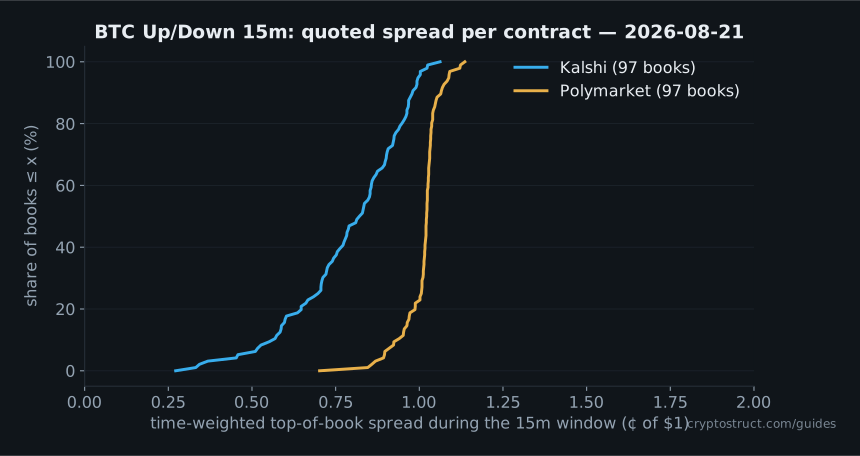
Polymarket’s books sit almost exactly at a one-cent spread all day — the inter-quartile range spans just 1.01–1.03¢. Kalshi is the surprise: although ~97% of its book levels land on the one-cent grid, the venue quotes sub-cent price levels at the top of book often enough that the median time-weighted spread drops to 0.82¢. Both books were two-sided most of the window: 94.7% quoted-time share on Kalshi, 89.6% on Polymarket (median per contract).
Depth and flow: a 12× book, a 24× tape
| 2026-08-21, BTC Up/Down 15m | Kalshi | Polymarket |
|---|---|---|
| Windows measured | 97 | 97 |
| Median size at best bid / ask (contracts) | 3,244 / 3,400 | 277 / 255 |
| Trades (day total) | 2,949,332 | 125,403 |
| Volume (contracts) | 239.2M | 3.5M |
| USD turnover | $125.7M | $1.8M |
| L2 book events | 50.5M | 25.6M |
| Median quoted-time share | 94.7% | 89.6% |
Window-anchored day totals from the tick archive. 2026-08-21 was a heavy BTC day — the 30-day averages are ~1.07M trades/$39M (Kalshi) and ~88k/$1.2M (Polymarket) per day, an activity ratio of roughly 12–30× depending on the day.
The headline asymmetry is not the spread — it is everything behind it. Kalshi’s touch carries roughly twelve times the contracts, and its tape prints about twenty-four times as many trades. For a taker strategy this is the difference between clipping a few hundred dollars and a few thousand dollars of expected value per fill without moving the book; for a maker it is the difference between queueing behind 3,000 contracts and being 30% of the visible size yourself.
Despite the liquidity gap, the two venues agree on the odds: mid-prices converge along nearly identical paths (next chart). Cross-venue signals between the two books are therefore about who updates first — a latency and flow question, not a mispricing free lunch.
The settlement endgame: both books pick the side the same way
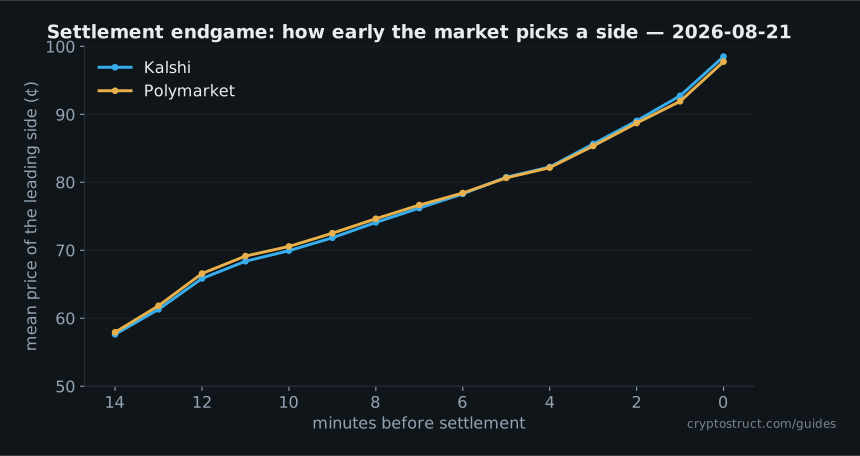
Fourteen minutes before settlement the leading side trades near 58¢ — the market knows almost nothing. It crosses 80¢ around five minutes out and 90¢ with roughly ninety seconds left. In the final 60 seconds the leading side stood at 95¢ or higher essentially the whole time, in every window, on both venues (median pinned share 100%). If your strategy needs time to act on a resolved outcome, the profit window is the two–five-minute band, not the last seconds.
What this means for the data you download
- File counts differ by design: a Kalshi day of this series is ~90 contract files (one per window, ~15 minutes of events each); a Polymarket day is ~184 files whose books span many hours — always anchor analysis on the contract’s window, not on the file’s first/last event.
- A heavy Kalshi day of this single series is ~50M book events; parsing streams (not loading into RAM) is the practical difference between minutes and out-of-memory.
- Expect sub-cent price levels in Kalshi books and (rarely) in Polymarket books — parsers that round prices to whole cents silently corrupt the top of book.
- Both series ship in the same schema as our crypto venues — a parser written for Binance files replays Kalshi and Polymarket books unchanged (format guide).
Which venue should a bot builder start with?
For training data, Polymarket’s longer archive (319 vs 179 days on this series) buys you nearly twice the settled windows — the binding constraint for supervised models (how much data do you need?). For execution, Kalshi’s depth means realistic fills at meaningful size, and its busier tape gives microstructure features more to work with. The strongest setups we see use both: train and cross-validate on the venue with history, and let the other venue’s book act as a real-time feature — the endgame chart says they price the same event, so a divergence between them is information.
Limitations
- This is one UTC day (2026-08-21) of one series family (BTC 15m). The day was ~2.8× busier than the trailing-30-day average on Kalshi — day totals above are not typical-day estimates; the 30-day averages in the table caption are.
- Spread and depth are top-of-book, time-weighted over the L2 replay while the book was two-sided and chain-intact; brief gap-suspect periods are excluded.
- Percent-style spread measures (bps of price) are intentionally absent — they degenerate on 0..1 contracts as price approaches either bound.
- "Settlement" is anchored at the window end derived from the contract identifier; official resolution semantics (Kalshi exchange determination vs Polymarket on-chain resolution) differ and can add minutes after trading effectively stops.
- USD turnover is price × contracts from the tape; Polymarket figures are in USDC.
Reproduce this analysis
Everything above comes from two series-day bundles — Kalshi BTC Up/Down 15m and Polymarket BTC Up/Down 15m, €1 per series-day each in the shop. Free full-day samples of both venues are on the downloads page, together with the dependency-free Python reader used for the replay.
| Series | Venue | Days | Coverage | Size | |
|---|---|---|---|---|---|
| BTC Up/Down 15m | Kalshi | 240 | February 2026 – present | 118 GB | Browse days |
| BTC Up/Down 15m | Polymarket | 380 | October 2025 – present | 132 GB | Browse days |
Live archive coverage of the two series compared in this guide.
Why buy the data in this guide here
Four things every page on this site is built on — and the reason the numbers above exist at all.
We record everything
The complete public feed of each venue as it was published: every Level-2 snapshot and update at the venue's full book depth, every trade with its aggressor side, every quote, funding, mark-price and liquidation event — for every instrument the venue lists, every UTC day since we added the venue. Nothing sampled, no top-N cut, no on-demand capture.
Institutional grade
Captured co-located at the venue with the exchange timestamp and our receive timestamp in integer nanoseconds, an event-id chain that makes any gap visible, and one normalized schema across 35+ venues — the same capture our own high-frequency trading engine and enterprise feeds run on.
€1 per instrument-day
Any instrument-day is €1, series-day bundles start at €1 — no subscription, no minimum order, no tiers to unlock. Credit packs lower the effective price and never expire, and every venue has free full-day samples to test against first.
Self-service for everyone
Pick the days in the Data Shop, pay by card as a guest and download immediately — no sales call, no enterprise contract, no KYC. Coding agents buy the same files through the MCP server, and the free Agent Skill teaches them the format.
Agents: /llms.txt · MCP server /mcp · every page as markdown via Accept: text/markdown
Frequently asked questions
Is Kalshi or Polymarket more liquid for BTC up/down markets?
On the measured day, Kalshi: ~3,200–3,400 contracts at the touch vs ~250–280 on Polymarket (~12×), with ~24× the trade count on the same product. Polymarket’s spread was pinned at ~1¢; Kalshi’s median was 0.82¢ thanks to sub-cent quoting.
Do Kalshi and Polymarket prices agree with each other?
Yes, remarkably closely: averaged over 97 matched 15-minute windows, the price path of the leading side tracked within about one cent between the venues at every minute before settlement.
What tick size do Kalshi and Polymarket use?
In the recorded books, ~97% of price levels on both venues land on a one-cent grid, but both carry finer levels — Kalshi noticeably so at the top of book, which pushes its effective spread below one cent. Parsers must not round prices to whole cents.
How fast do 15-minute up/down markets converge to 0 or 1?
Slowly, then all at once: the leading side averages ~58¢ fourteen minutes out, crosses ~80¢ around five minutes and ~90¢ with about ninety seconds left; in the final minute it sat at 95¢+ in essentially every measured window on both venues.
Can I get the underlying tick data?
Yes — both series are sold as series-day bundles (every contract of the series for one UTC day, €1) with full L2 order-book depth and every trade, in the Data Shop; free samples are on the downloads page.